The difference between Business Metrics and KPI’s
Why it’s important for Business Performance Management
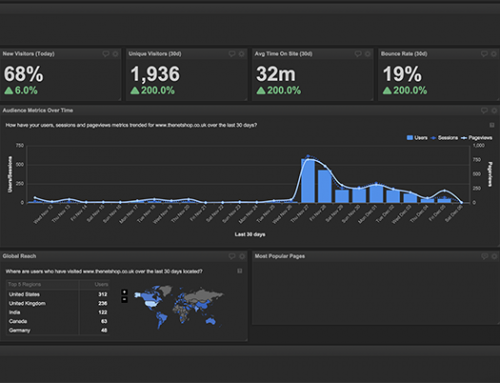
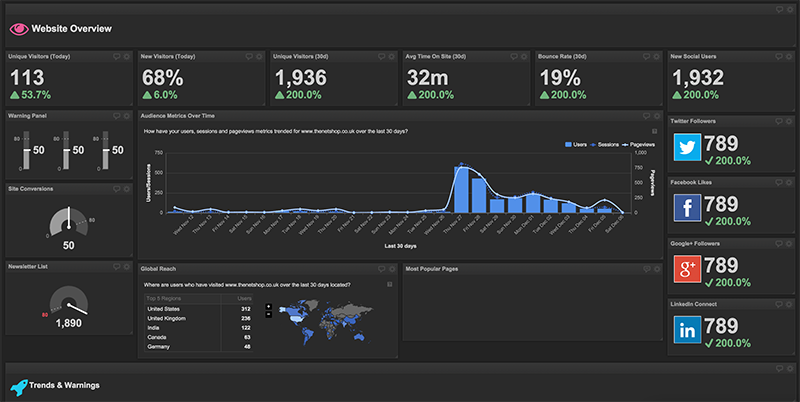
The BI business is growing at a fast pace with the introduction of the recent Data Discovery trend. Business Intelligence Dashboards are fast becoming a desirable and in fact a necessity to enable businesses to get one up on the competition.
For businesses to gain the competitive edge and start on the journey of Business Intelligence and Data Discovery they need to fully understand thier own business objectives and who will be using the dashboards to empower them to drive the business objectives along with probably the key to all dashboards, what sort of business data sources they should be using.
To have an effective dashboard it is vital to establish business metrics and KPI’s, they are different. Often those that build dashboards, both internally within an organisation and external third party suppliers, confuse the two.
The objective of a dashboard is to empower the user to take actions that will improve business performance.
So what exactly are Business Metrics and KPI’s?
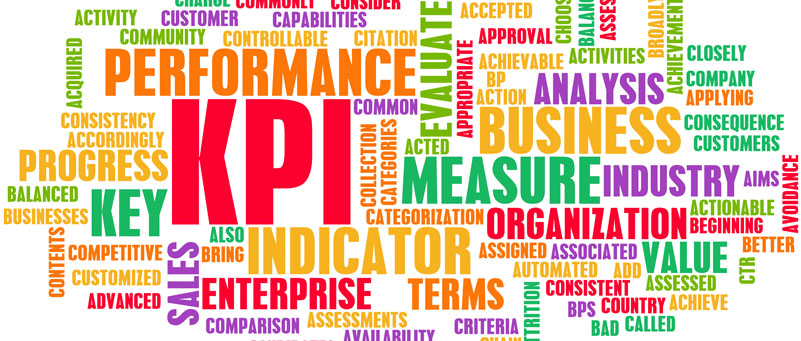
Definition of Business Metrics
Business Metrics, sometimes referred to as Performance Metrics, measure the performance and activities of an organisation. These metrics are retrieved and then reported.
 The best example of this would be in the finance department reporting such metrics as Turnover, profit etc, but business metrics can be found in just about any department.
Call Centres – Calls made, Calls answered, Wait time etc
Project Management – Safety, Time, Costs, Resources etc
In it’s simplistic form a Business Metric tracks a current snapshot of an organisation’s performance.
Definition of a KPI
 A Key Performance Indicator measures how effective the organisation is at achieving the business targets or strategy.
A Business Metric should be measured against a target and a KPI will measure the success of the organsiation to achieve this target.
Example of KPI’s
Finance – Net Profit Margin
Question: How much profit do we make for every sale?
Business Metric Required: Net Profit, Revenue
Target/benchmark: Pre-defined
The target can be set by the company or a benchmark can be set from industry standards.
So as a business you can see from the above example you need to know the question first before you can set your KPI. There are obviously many KPI’s that are common to all businesses and the Net Profit Margin would be one of those. Our Business Intelligence Lite Dashboards include many of these.
If the ‘standard’ KPI’s do not fit your business or you need additional KPI’s then you will need to define your own unique KPI’s. To do this you will need to come up with some Key Performance Questions.
“A business without a goal is just a dream”
Constructing a dashboard for Business Metrics and KPI’s
It can be difficult for organsiations new to dashboarding to actually get started with their first dashboard.
Problems with creating your first dashboard include:
- Deciding what business metrics to use effectively for your targets
- Choosing a visualisation application to display the information
- Knowing what KPI’s to use
- Creating a compelling dashboard that all users want to use
- How to share the dashboards with one Business Discovery Platform
The time and organisation required to get started can be overwhelming, so get started simply with some basic Business Metrics (not too many) and then tweak, add to and obtain feedback from your users.
Our approach at the Data Pathfinders is:
1. Get started with one of our Lite Dashboards with standard Business Metrics and some standard KPI’s
2. Obtain feedback from the client to start to ask the Key Performance Questions that are unique to their business
3. Develop the Pro version dashboard which becomes specific to the client requirements
4. When the client has specific requests that do not fall into the ‘standard’ dashboard categories such as ‘Financial‘, ‘Digital Marketing‘, ‘Sales‘, ‘Social Media‘, ‘Business Overview‘ etc then we create a custom dashboard unique to the organisation requirement.
Data Discovery – The added value component
So you have asked the Key Performance Questions and the KPI’s have been defined and the data source of the Business Metrics have been connected to your dashboard along with your targets.
At this point everybody is happy and your users are driving your business objectives.
There is more!
Now that your business metrics are all connected from numerous different sources, is there anything else in the data that you have stored and collected?
The answer is highly likely a resounding yes!
What about those Key Performance Questions you havnt asked, KPQ’s you didnt even know existed about your business?
Our Data Scientists have over 10 years experience and have identified KPQ’s that will give you incredible insight into your data that you would not even think of asking and are not ‘standard’ KPQ’s.
Let me finish with a small example that illustrates the added value that may lie in your data.
A recent analysis of one of our eCommerce clients revealed that 180,000 users of their website completed the product purchase form but did not checkout. An analysis of the why’s was carried out and an answer was determined. An opportunity had been identified and a simple email was sent to all of these users on a saturday afternoon reminding them that they had not checked out and a massive 37% bought straight away.
This is the power of Data Discovery and how it really can affect your bottom line.
Leave A Comment