What exactly is a
Business Intelligence Dashboard?
A Business Intelligence Dashboard is a visual representation of a company Business Metrics and Key Performance Indicators. It provides a snapshot of it’s current position and provides actionable insights.
The Business Intelligence Dashboard
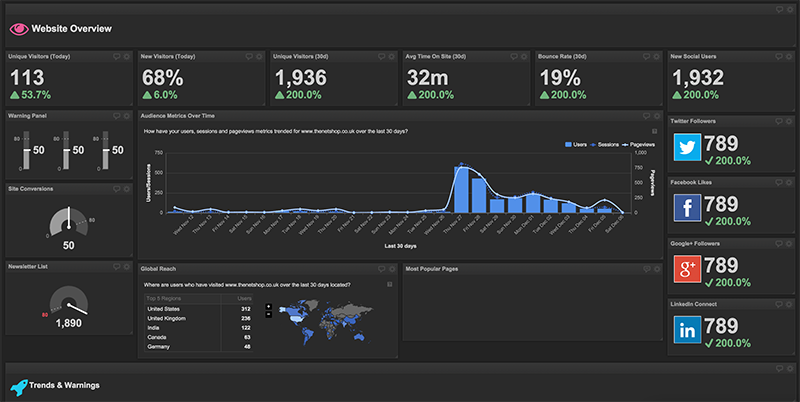
Essentially a Business Intelligence Dashboard connects real time data from both multiple internal and external sources and displays them on a graphical easy to understand web based dashboard made available for multiple users to enable those users to drive the company business goals and objectives.
To achieve this the BI Dashboard displays current Business Metrics and KPI’s either defined by the business or defined using Key Performance Questions. Depending upon the type of BM or KPI a type of graphical display is chosen that is suited to the metric, these can be gauges, numbers, bar graphs etc.
Historically there have been dashboards, that like a company balance sheet takes a snapshot of a companies performance, and there have been Business Scorecards which track performance over time.
With the recent trend of Data Discovery or the ability to derive value from a companies data, BI Dashboards and Scorecards are beginning to merge. Both the BI Dashboard and the Performance Scorecard are beginning to to become one as dashboarder’s start to combine the two.
There is not currently a newly termed name for this combination of dashboard and scorecard, but we think the term that would suit the combination could be ‘Business Discovery Dashboard‘. What do you think?
Elements of a Business Intelligence Dashboard
Business Metrics
Firstly a BI Dashboard needs data in the form of a business metric. To retrieve these BM’s the dashboard needs to connect to either internal resources or external (on the web) resources or both.
Example: If you were monitoring your financial performance of your business website you would call upon resources such as Sage, QuickBooksOnline or your own software package to get key business metrics such as Sales Revenue, Total Costs, Cost of Goods Sold, Operating Profit to name just a few
From these metrics you would connect the the useful metrics from some or all of the above and provide them on the dashboard.
Key Performance Indicators
Often there are ‘standard’ KPI’s for various departments or businesses, but sometimes businesses require specific, personalised or custom KPI’s. To identify those can sometimes be difficult so Key Performance Questions can help to carry out the identification process.
Once the KPI’s have been identified, and to get the results for these the dashboard needs to calculate them from the Business Metrics above, by mashing up the Business Metrics from all the different data sources.
Example: Using the same model you can now calculate KPI’s such as Operating Profit Margin, Gross profit margin, Net Profit Margin by using the Business Metrics.
e.g To calculate the Net Profit Margin KPI we would use the ‘Net Profit Metric’ and the ‘Revenue’ Metric using the following equation.
[latexpage]
\[
Net Profit Margin = (\frac{Net Profit}{Revenues}) x 100\%
\]
 The result of the calculation would then be visualised using most probably a number expressed as a percentage and indicating a trend compared to say last month.
Insights and Data Discovery
The fairly recent explosion of Big Data has required companies such as HP Vertica to not only handle the BroncoBytes of big data but to actually analyse the data in a big way and in HP vertica’s solution extremely fast. The objective is to discover hidden trends in what is sometimes termed ‘dark data’, The dark data is often never found, but when it is, it uncovers important trends and insights into a businesses data. These discoveries can then be connected to the BI Dashboard and now our newly keyed phrase ‘Business Discovery Dashboard’ starts to make sense.
How it works

The process of creating a BI Dashboard is essentially quite simple. Once the Business Metrics and KPI’s have been defined it is a case of collecting them from the various resources that contain the data.
Connecting these metrics straight to the dashboard misses out on probably the most important element, the crunching, mashing and analysis of the data.
The collected metrics are then stored in a secure cloud warehouse where the data can be analysed and crunched to provide meaningful output to the dashboard.
The dashboard then connects to the data warehouse and converts the outputted data (Business Metrics, KPI’s and Insights) into great looking, easily understood graphical displays.


Leave A Comment